Summary
In this post, I’m going to explain a couple techniques and tools that every developer should know. If you are just graduating from college and you are looking for a .Net job, learn these simple techniques and advance your career. If you’re a mid-level to advanced .Net developer and you don’t know these tools and techniques yet, learn them. These tools and techniques will save you time and give you the edge to building better software.
SQL Profiler
Let’s assume you have built this outstanding program. It’s a work of art. It uses .Net Core 2.0 with IOC containers, Entity Framework Core 2.0 and other advanced technologies. You’re testing your web-based software and you notice a pause when you click on a button or a page is loading. The first thing that pops into my mind is: What is causing the slowdown? Is it the database or the IIS server? Finally, what can I do about it?
Let’s eliminate or confirm the database. If you have installed the profiler tool in SQL (I’m going to assume you did, otherwise you’ll need to start the installer and install this tool), then go to the Tools menu and select SQL Server Profiler. A new window will open and you’ll need to connect to your database instance as though you are opening the management studio itself. Once you open the profiler, it’s time to execute that page that you are having issues with. You can click on the stop button and use the eraser to clean up any records that have shown in the window already. Get to the point where you are about to click the button to your web page. Then hit the run button in the profiler and hit the web page. Once the page loads, then hit the stop button in your profiler so nothing else will record. Now you have records to analyze. You’ll be surprised at the number of database calls EF will perform.
I used this project as a demo for the screenshot coming up:
https://github.com/fdecaire/MVCWithAutoFacIOC
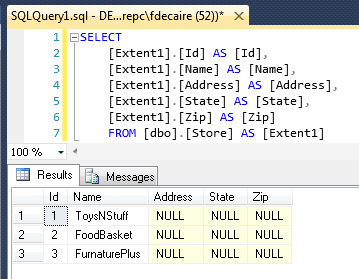
Download the project, run the database create script (store_product_database_setup.sql) and run the application. You should see something like this:

As you can see there is one call to the database and you can see the “select” command. Click on the “BatchStarting” line and notice the detail in the window at the bottom:

Now you can scrape that query and paste it into the Server Management Studio and test the exact query that your Entity Framework is sending to SQL:
This will indicate if you are querying for too many fields, or the total records queried are crazy. If you discover that your query result was a million records and your interface only shows the top 10 records, then you need to tweak your LINQ query to only ask for 10 records. In this tiny example we have three records. Let’s make it ask for 2 records. Here’s my original LINQ query:
(from s in _db.Stores select s).ToList();
I changed it to:
(from s in _db.Stores select s).Take(2).ToList();
Re-run the program, capture the data in profiler and this is what I get:

Notice the “Top(2)” difference in the query. This is the kind of performance tuning you should be aware of. It’s very easy to create C# code and LINQ queries, only to never understand what is really going on behind the scenes. Entity Framework takes your LINQ query and turns it into a string that represents a SELECT query and transmits that to MS SQL. Then MS SQL queries the database, returns the results so that EF can turn it back into a list of objects. With SQL profiler, you can get into the nuts and bolts of what is really going on and I would recommend you run profiler at least once after you have built your software and think it is ready for prime-time. If you see a query pause, copy the profile SQL query into management studio and see if you can speed up the query and get the query results that you need.
Another tool you can use is the estimated execution plan tool. The toolbar button looks like this:

This tool will break your query down into the pieces that will be executed to form the results. In the case of my previous query, there is only one piece:

That piece of the query costs 100% of the execution time. If your query included a union and maybe some sub-queries, this tool is very useful in determining which part of the query is costing you the most processing cycles. Use this tool to decide which part of your query you want to focus your energy on. Don’t waste time trying to optimize the portion of your query that only takes 2% of the execution time. Maybe you can get that to go twice as fast, but the overall query will only be about 1% faster than before. If you focus your energy on a section that takes 98% of your execution time, then you’ll be able to boost the performance in a noticeable manner.
Web Server Troubleshooting
If you’re using IIS, some day you’ll run into a problem where you don’t get any logs and your website or API crashes immediately (usually a 500 error). This is always a difficult problem to troubleshoot, until you realize that there are only a hand-full of problems that cause this. The most common problem is an issue with the XML formatting in your web.config file. I can’t tell you how many times I have been bit by this problem! The easiest way to test and troubleshoot this error is to open the IIS manager control panel, select your website and then click on one of the icons that displays a section of your web.config file, like “Modules”:

If there is an error, then the line number in the web.config file will be shown. You’ll be able to look at the xml in the web.config and see your missing tag, extra quote or other symbol (sometimes it’s an “&”, “>” or “<” symbol inside your database connection string password or something). Fix the web.config issue and go back to modules again. If there is another error, then fix it and return again, until it works.
On .Net Core, there is an error log that can report startup errors. This logging happens before your log program starts and is very handy for situations where you don’t get any logging. When you publish your site to a folder in .Net Core (or Core 2.0), you’ll end up with a bunch of dlls, some config files and a web.config file. The web.config file is mostly empty and might look like this:
<?xml version="1.0" encoding="utf-8"?>
<configuration>
 <system.webServer>
 <handlers>
 <add name="aspNetCore" path="*" verb="*" modules="AspNetCoreModule" resourceType="Unspecified" />
 </handlers>
 <aspNetCore processPath="dotnet" arguments=".\Website.dll" stdoutLogEnabled="false" stdoutLogFile=".\logs\stdout" />
 </system.webServer>
</configuration>
Change your “stdoutLogFile” parameter to point to a file location that you can find. I usually set mine to “C:\logs\myapplication_logging_error.txt” or something like that. Then I run the program until it crashes and check in the c:\logs directory to see if the file exists. If it does, it usually contains information about the crash that can be used to troubleshoot what is going on. I’m assuming at this point in your troubleshooting, the website or API works from Visual Studio and you are having issues with the deployed application. If you are having issues with executing your application in Visual Studio, you should be able to zero in on the error in VS using breakpoints and other tools.
For NLog there is an error log for the error log. This is where the errors go when there is an error detected in the NLog code. Usually caused by a configuration error. At the top of your nlog.config file should be something like this:
<?xml version="1.0" encoding="utf-8" ?>
<nlog xmlns="http://www.nlog-project.org/schemas/NLog.xsd"
 xmlns:xsi="http://www.w3.org/2001/XMLSchema-instance"
 autoReload="true"
 internalLogLevel="Warn"
 internalLogFile="C:\logs\myapplication_nlog.txt">
As you can see, there is an “internalLogFile” parameter. Set this to a location and filename that you can find. Then execute your program and see if that log file appears. If it does, then open it up and examine the contents. Usually it’s an exception error involving the NLog logger.
Application Pools
The application pool type must match the .Net version that you are using. For .Net Core and Core 2.0, you’ll need to use “no managed code”. For .Net, you’ll set your pool to “.Net Framework v4.0”. If you are unfortunate enough to be using really obsolete legacy code, you can set it to “.Net Framework v2.0”.
When you deploy your Core 2.0 application, you may need to cycle the application pool. You’ll run into a problem where you deploy new code and the “bug fix” or “new feature” does not show up. Cycle the app pool and see if it fixes your problem. The application pool might be using a copy of the previous program in memory.
Sites
Inside your site settings, there is an ASP settings section:

You can turn on debugging flags inside here. For your local development system, turn it all on:

Leave these settings off for any production system. You do not want to advertise the line numbers of your code (and your code) when you have a crash. For development purposes, you want to know all the data you can get from an exception. If these settings are on, you’ll get the full dump of the exception message in your browser and then you can return to Visual Studio to find the exact line of code where the error occurred.
I hope this saves you some time when a frustrating deployment problem occurs. The trick is to learn the most common causes of deployment problems so you don’t spend all day troubleshooting a tiny error instead of working on that next big chunk of code.